Topic 8 of 10
Market analysis
The basics of technical analysis: candles, trend, support and resistance, timeframes. You also get a first look at fundamental analysis and why no method can predict the market.
3 video lessons · 8 key terms
Videos in this topic
Text lesson
Market analysis is the attempt to understand what price has done and what it might do next. It cannot predict the future. It helps you describe the situation and plan what you will do in different cases. There are two main types, technical and fundamental analysis.
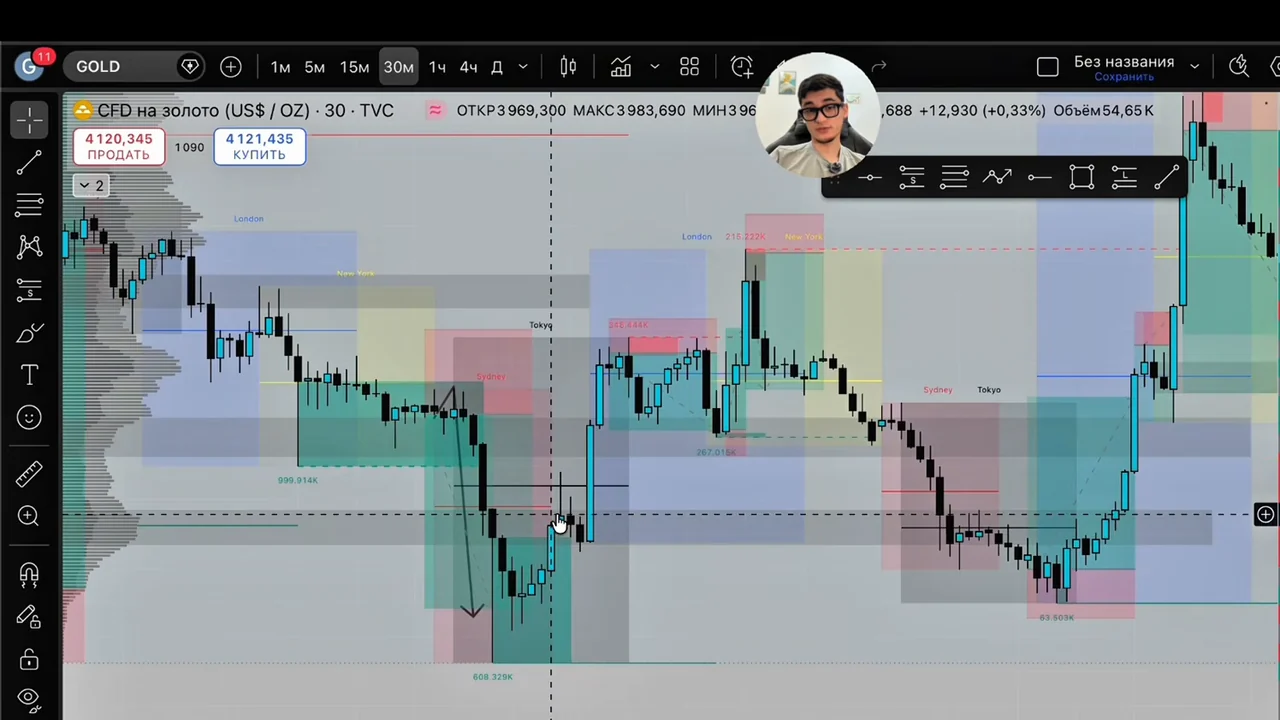
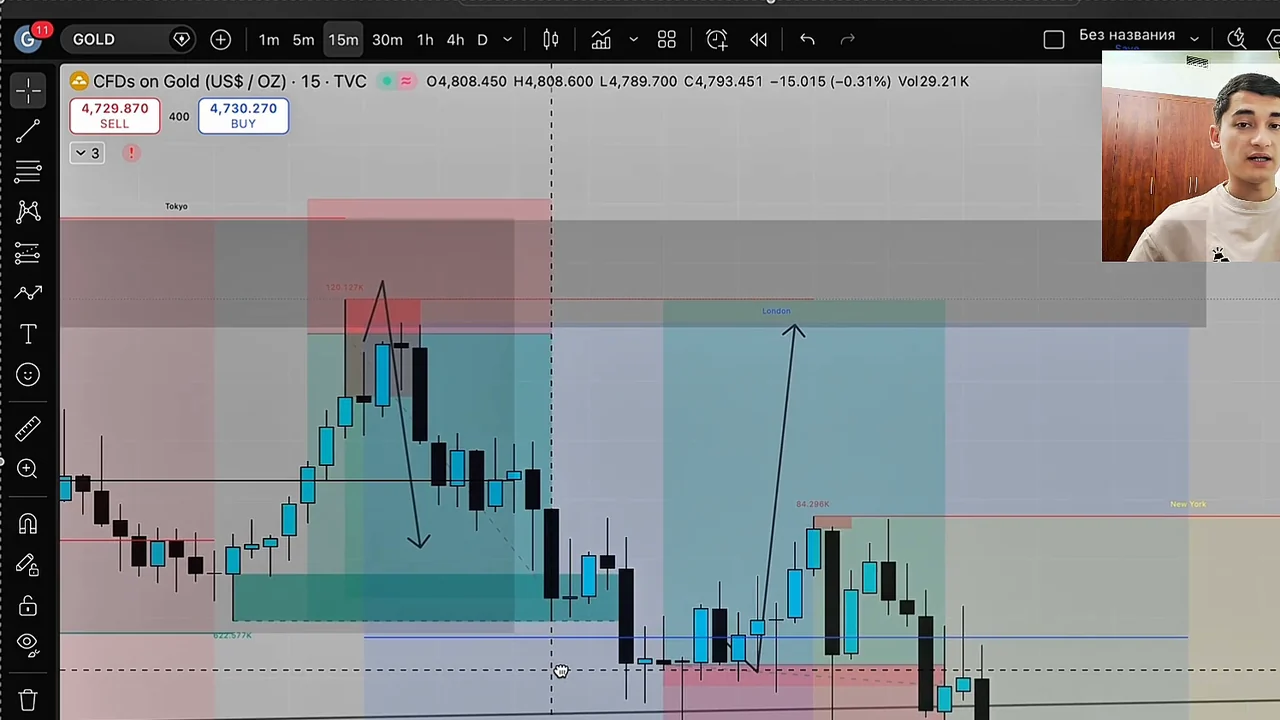
Technical analysis studies the chart. The basic building block is the candle. One candle shows four prices for a period: the open, the high, the low and the close. The thick part is the body, between open and close, and the thin lines are the shadows, which reach the high and the low. If the close is above the open, the candle is usually drawn as bullish, and if it is below, as bearish. The period depends on the timeframe. On an H1 chart each candle is one hour, and on a D1 chart each candle is one day.
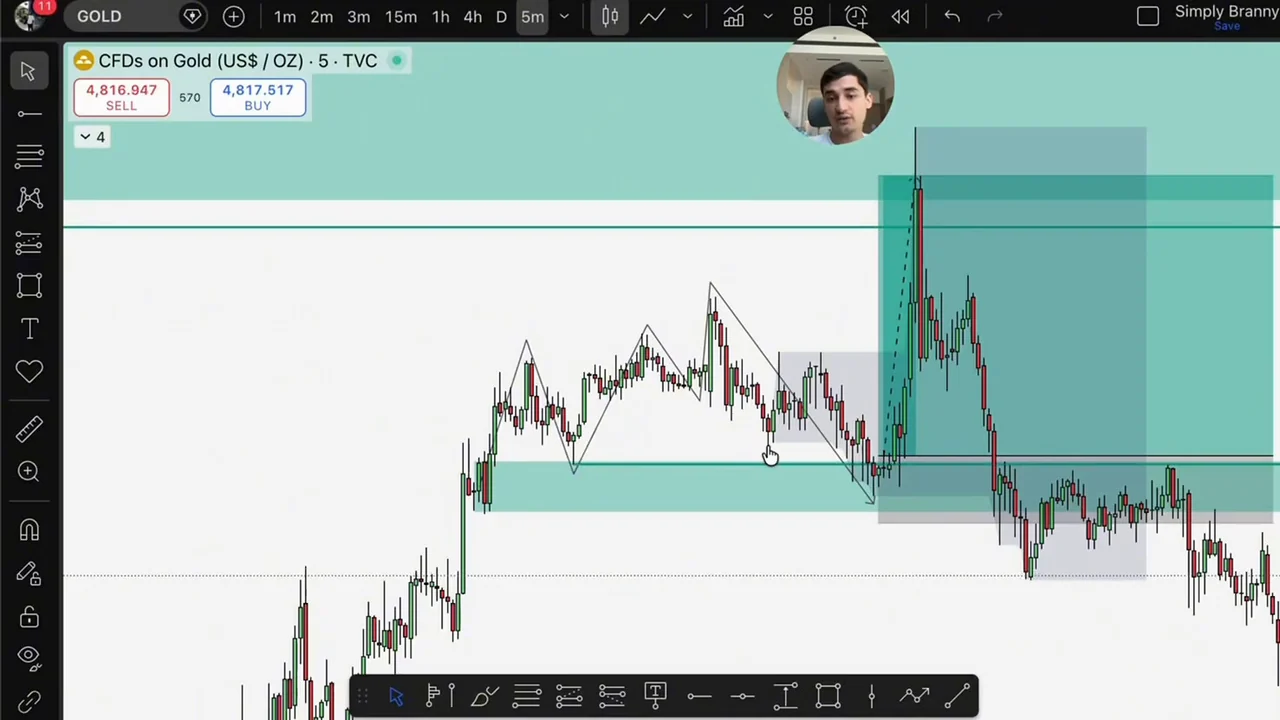
A trend is the general direction of price. In an uptrend, price makes higher highs and higher lows. In a downtrend, it makes lower highs and lower lows. When it does neither, it moves sideways. Beginners often draw a trendline through the lows of an uptrend or the highs of a downtrend to see how the market behaves.
Support and resistance are price areas where price stopped or turned before. Support lies below the price and resistance above it. They are zones, not exact lines. A level that held many times can also break, and then it often changes its role.
Timeframes matter. A higher timeframe such as H4 or D1 shows the bigger picture and the main levels. A lower timeframe such as M5 or M15 shows details for entries and exits. A common habit is to look at the larger one first and then zoom in, so you do not trade against the main direction without noticing.
Some traders also study liquidity, which means where many orders, such as stop losses, are probably sitting, for example above a recent high. Others study market sessions, because activity differs between Asia, London and New York. These are methods that people use to organise what they see. They are ideas to test on a demo account, not rules that always work.
Fundamental analysis looks at the reasons behind moves: interest rate decisions, inflation, employment reports and political events. Such news can move price sharply in seconds, and spreads usually widen at that moment. Many beginners prefer to stay out of the market around big releases.
Be honest about the limits. Every method gives false signals. Two people can read the same chart in opposite ways. Whatever you study, test it on a demo account, write down the results, and always decide your stop loss first.